Most companies break even on returnable packaging within 8 to 18 months when shipping volume exceeds 50 trips per year per container. The exact payback depends on container cost, single-use alternative price, return-loop distance and loss rate. This guide shows how to build an accurate ROI model for reusable plastic containers in your supply chain.
Comparing Euro, attached-lid and nesting formats? The industrial plastic crates types and sizes guide covers them side by side.
What Is Returnable Packaging?
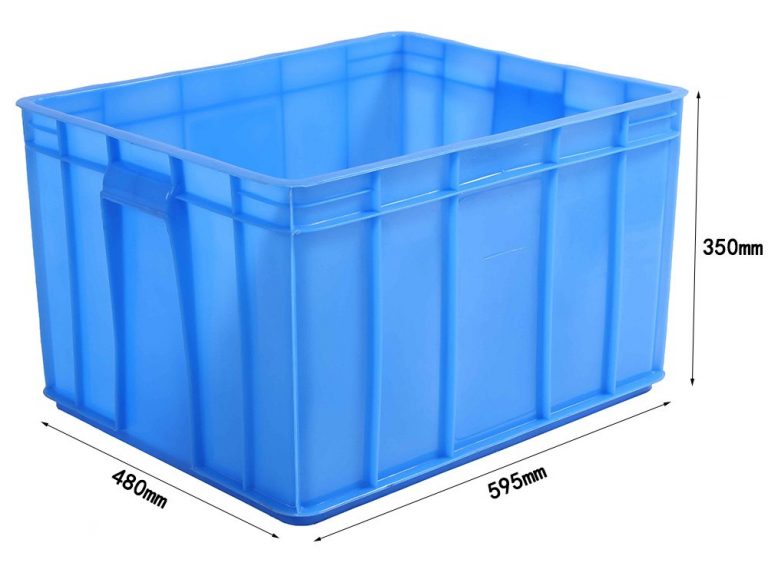
Returnable packaging refers to reusable containers, pallets and totes that circulate between a supplier and customer multiple times instead of being discarded after one use. Common examples include plastic turnover boxes, attached-lid containers, collapsible crates and stackable euro containers.
Unlike single-use cardboard or wood, returnable packaging is designed for 50 to 500+ use cycles. The upfront cost is higher, but the per-trip cost drops sharply after break-even.
Cost Comparison: Single-Use vs Reusable
The table below compares a typical single-use cardboard box against a reusable plastic container over a 3-year period.
| Cost Factor | Cardboard Box (single-use) | Plastic Container (reusable) |
|---|---|---|
| Unit purchase price | $1.50 | $18.00 |
| Trips per year | 1 | 60 |
| Lifespan | 1 trip | 5 years (300 trips) |
| Annual spend (1000 units) | $90,000 | $3,600 amortised + $1,200 cleaning |
| Waste disposal cost | $2,400 / year | $0 |
| Product damage rate | 3.5% | 0.8% |
| 3-year total cost | $277,200 | $58,800 |
In this example, the reusable system saves $218,400 over three years—a 79% reduction in packaging spend. Damage-rate improvements add further savings by reducing returns and rework.
How to Calculate Returnable Packaging ROI
Use this simple formula to estimate payback for your own operation:
ROI Months = (Container Cost – Residual Value) ÷ (Single-Use Cost per Trip + Damage Savings + Labour Savings – Return Logistics Cost)
Step-by-Step Inputs
- Container cost: Purchase price per reusable unit, including any dividers or labels.
- Expected lifespan: Number of trips before the container is retired. Most HDPE containers last 100–300 trips.
- Single-use cost per trip: Price of the cardboard box, bag or wrap you currently use, including tape and void fill.
- Return logistics cost: Cost to ship empty containers back. If backhaul trucks run empty anyway, this can be near zero.
- Damage savings: Reduced product damage multiplied by average product value and return rate.
- Labour savings: Time saved on assembly, taping and breakdown of single-use packaging.
Break-Even Timeline: When Do Reusable Containers Pay Off?
For a plastic turnover box costing $15, replacing a $2 cardboard box:
- At 1 trip per week (52/year): break-even in ~17 weeks (4 months)
- At 2 trips per week (104/year): break-even in ~9 weeks (2 months)
- At 5 trips per week (260/year): break-even in ~4 weeks (1 month)
If your return loop is long—such as international sea freight—add transport cost and container loss rate (typically 2–5% per year) to the model. Even with these penalties, most closed-loop supply chains see payback within 12 months.
Hidden Savings Most Buyers Miss
Beyond direct packaging cost, reusable containers unlock savings that do not appear in simple price comparisons:
- Warehouse space: Collapsible crates reduce empty storage volume by up to 75%.
- FSMA and hygiene compliance: Washable plastic containers meet food-safety standards that cardboard cannot.
- Inventory accuracy: Standardised container sizes improve cube utilisation and WMS slotting.
- Carbon reporting: Reusable packaging reduces Scope 3 emissions, supporting ESG targets.
Conclusion
Returnable packaging pays for itself quickly when trip frequency is high and return logistics are efficient. The key is to model all cost layers—not just the purchase price—so you can present a clear business case to procurement.
Looking for reusable plastic containers with proven ROI? LSY Plastic manufactures nestable, stackable and collapsible containers in euro sizes and custom dimensions. Message us on WhatsApp +86 19311059570 or email fstyx01@lsyplastic.com to request a sample and ROI worksheet.