Short answer: for any drinks operation moving more than a few hundred bottles or cans per week, returnable plastic beverage crates beat cardboard and shrink wrap on cost within 8–15 trips, protect packaging from crush damage, and cut waste volumes to near zero. The right choice comes down to four things: the container format you distribute (glass bottles, PET bottles, cans), your stack height in the truck and warehouse, whether empties need to nest for the return leg, and how often crates will be washed. This guide walks through crate types, capacity matching, material selection and the payback math that distributors in the Middle East, Africa and Southeast Asia use to justify the switch.
Why Drinks Distributors Are Moving From Shrink Wrap to Returnable Crates
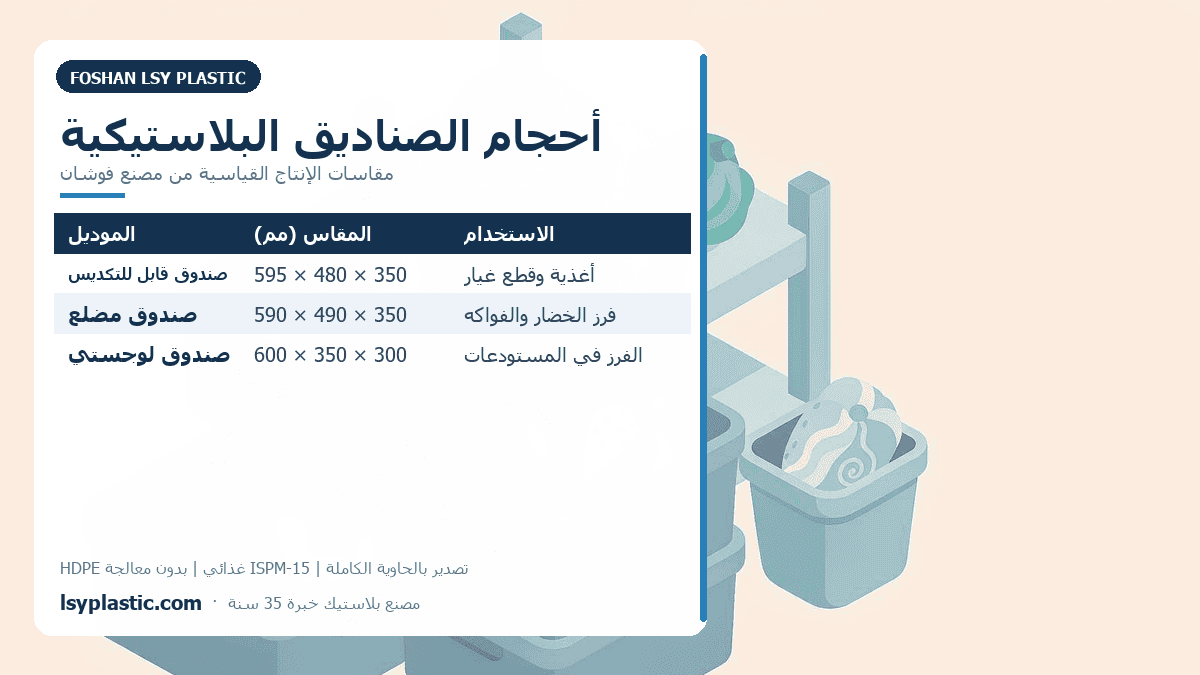
Cardboard wrap and one-way trays look cheaper on a per-trip quote, but they fail in exactly the places beverage logistics is hardest: humid loading docks, multi-drop routes, and stacked storage in small back rooms. Single-trip packaging absorbs water, loses stacking strength after one handling cycle, and generates a constant waste stream that someone has to pay to remove. A molded HDPE or PP crate keeps its rated stack load for hundreds of cycles, sheds water, and can be hosed down or washed between runs.
Three operational gains show up first after switching:
- Damage rates fall. Cans and PET bottles stop getting crushed in the lower layers of a pallet; glass bottles are separated by dividers instead of rattling against each other.
- Truck utilization improves. Consistent crate footprints stack into clean, interlocked columns, so loads are planned instead of improvised.
- Labor per drop drops. Handlers carry defined units instead of re-building wrapped trays that collapsed in transit.
If your routes also serve hotels, restaurants and catering kitchens, the same crate fleet often does double duty — see how service crates move plates, glassware and food between kitchens and venues.
Main Types of Plastic Beverage Crates
Open-handle bottle crates
The classic beer- and soft-drink crate: an open-top box with wide grip handles on the short sides and a reinforced rim for stacked carrying. Open walls make loading fast and give bottles airflow in hot climates. Standard capacities run from 12 to 24 bottles. Choose this type when speed of manual handling matters more than sealing out dust.
Closed beverage boxes with lids
A closed crate with a hinged or detachable lid protects contents from dust and light and stacks more securely, because the lid acts as a load-bearing surface. This is the preferred format for longer distribution legs, third-party warehousing and any route where crates are stored outdoors or in open trucks.
Partitioned crates for glass bottles
Divided crates hold each bottle in its own cell, which is what glass needs. Dividers can be molded into the base as posts or added as loose separators. For returnable glass programs — breweries, water bottlers, dairy-style routes — partitions are non-negotiable, since one loose bottle shattering contaminates the whole crate.
See the Crate hub for the full range and specifications.
Stack-and-nest dairy-style crates
Rotated 180°, the crates nest inside each other for the empty return leg, saving up to 70% of return volume; stacked one-way, they carry full loads. The same logic used for milk and dairy distribution applies directly to chilled RTD coffee, juice and water routes.
Sizes and Capacity: Matching Crates to Your Containers
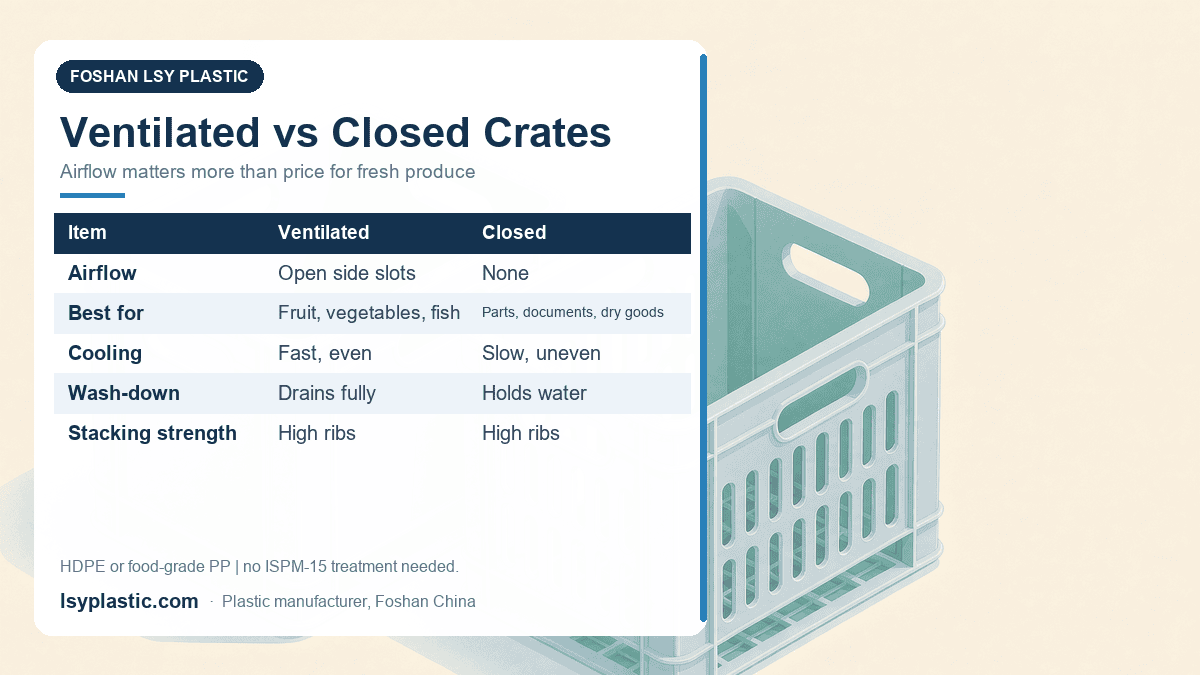
Beverage crates are usually quoted by nominal bottle/can count, but the number that matters is your container in that crate. Before ordering, fit-test one sample crate with your actual SKU, including the tallest cap and any shrink sleeve. Common configurations:
| Crate type | Typical load | Footprint (mm) | Best for |
|---|---|---|---|
| Open-handle 24-can | 24 × 330–355 ml cans | 400 × 300 | Canned beer, soda, energy drinks |
| Open-handle 12-bottle | 12 × 500 ml PET/glass | 400 × 300 | Water, soft drinks, short routes |
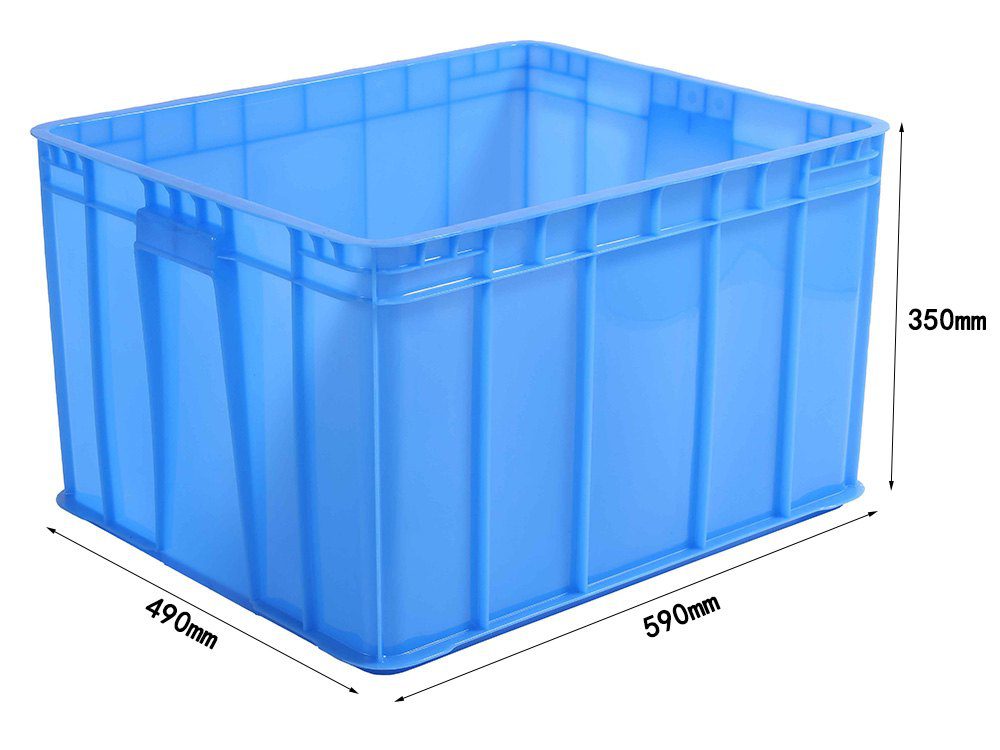
| Closed box 20-bottle | 20 × 330 ml glass | 600 × 400 | Breweries, returnable glass |
| Partitioned 12-bottle | 12 × 750 ml glass | 600 × 400 | Wine, spirits, juice glass |
| Stack-nest 6–9 × 1 L | 6–9 × 1 L cartons/PET | 600 × 400 | Dairy-style chilled routes |
The 400 × 300 mm and 600 × 400 mm footprints above are the Euro modular sizes, which is why they pay off long-term: two small crates occupy exactly one large crate’s footprint, and everything stacks onto standard 1200 × 800 or 1200 × 1000 pallets without overhang. If you also move dry goods on the same pallets, it is worth reviewing how the Euro container size system works so your whole fleet shares one footprint logic.
HDPE vs PP: Picking the Material
Both polymers are food-contact safe and both survive years of beverage duty; they differ at the margins. HDPE is slightly more rigid and holds stiffness in high heat, which matters for open trucks in Gulf summers. PP offers better hinge life (for crates with integral lids), excellent chemical resistance to cleaning agents, and slightly better impact behavior at low temperature for chilled and cold-chain routes. In practice most distributors standardize on one material across the fleet to keep replacement parts and recycling streams simple — the deeper trade-offs are the same as those between HDPE and PP pallets.
Two specification details matter more than the polymer name: wall thickness at the handle bosses (the first place cheap crates crack) and UV stabilization, since outdoor storage is what ages an unpigmented crate fastest. Ask suppliers for UV masterbatch content and the handle-drop test result, not just a resin designation.
Stacking, Nesting and Truck Fill
Stacking is where crate fleets quietly win or lose money. Full crates stack 4–6 high with a rated load well above the weight of the contents; the practical limit is usually the person unloading them, not the crate. The numbers to check on a spec sheet:
- Stack load (rated): the load the bottom crate carries in a 5-high stack — should exceed your heaviest filled configuration by at least 2×.
- Nesting ratio: for stack-nest models, how many empties fit in the footprint of one stacked crate. 4:1 is typical; 5:1 or better transforms return-leg economics.
- Tare weight: lighter crates cut fuel, but sub-1.3 kg handles in 24-bottle formats usually telegraph a thin-wall design that will crack at the bosses.
If you are comparing nested versus pure stacking designs for a mixed fleet, the space economics are analyzed in detail in stackable vs nesting plastic crates.
Returnable Crate Economics: A Simple Payback Model
You do not need a consultant to justify crates — you need three numbers:
- One-way packaging cost per trip: tray + stretch wrap + label, including disposal fees.
- Crate cost per unit: delivered price of the crate.
- Trips per crate per year and expected crate life: routes per week × 52, against a realistic 5–8 year service life.
Worked example: a distributor spending USD 0.35 per trip in trays and film, running 250 trips per crate per year, buying crates at USD 7.50. Annual packaging saving is 250 × 0.35 = USD 87.50 per crate against a one-time USD 7.50 cost — payback in under 5 weeks of duty, with 5+ years of service left. Even with conservative assumptions (loss rates, washing labor, 60% utilization), returnable crates pay back inside 8–15 trips. The sensitivity that decides everything is crate loss rate: above roughly 5% per year, the model degrades, so serialization, deposit schemes and depot discipline protect the investment more than any price negotiation.
Hygiene, Washing and Store-Back Discipline
Beverage crates live a wet life: condensation, dock dust, sticky spills. Smooth interior radii and drainage slots in the base make hosing effective; crates destined for dairy-style chilled routes should tolerate 60–80 °C wash water. Between wash cycles, store returned empties off the floor and invert them or cover them so the interior surfaces that touch your product never sit exposed in the warehouse. These are the same sanitation principles food processors apply to washing and sanitizing plastic crates, and they cost almost nothing when designed in from the start.
Buying Checklist for Beverage Crate Fleets
- Fit-test with your tallest bottle/cap and your coldest, wettest product line.
- Confirm footprint matches your pallet program (Euro 400×300 / 600×400 preferred).
- Ask for stack-load rating at 5-high, not just “stackable”.
- For stack-nest models, get the measured nesting ratio, empty and with dust.
- UV masterbatch and handle-drop test evidence in writing.
- Wash-water temperature tolerance if crates enter a washing line.
- Color plan: fleet colors by route or customer prevent cross-depot losses.
- Spare-part and recycling commitment: a supplier that granulates end-of-life crates back into new ones keeps your fleet’s residual value.
Ready to compare options? Browse our Turnover Box Series range for plastic crates and turnover boxes.
Frequently Asked Questions
How many trips does a plastic beverage crate last? A well-specified HDPE or PP crate in normal distribution duty survives 300–500+ loaded trips over 5–8 years. Life ends at handle-boss cracks or rim wear, both of which are visible in inspection long before failure.
Can the same crate carry bottles and cans? Physically yes, but partitioned glass crates waste can volume and open can crates let glass rattle. Fleets normally split formats by container type and keep footprints identical so stacking still works.
Are beverage crates food-contact safe? Virgin HDPE and PP comply with EU 10/2011 and FDA food-contact requirements; request the declaration of compliance from the manufacturer, especially if colored regrind is offered at a discount.
What causes most crate failures? Handle-boss cracking from under-spec walls, UV embrittlement from years of outdoor storage, and rim damage from over-stacking above the rated height. All three are specification and discipline issues, not material limits.